Leave a Message

Thank you for your message. We will be in touch with you shortly.

Bay Area Market Statistics | May 2024

Market Update

Bay Area Market Statistics | May 2024

Welcome to the May 2024 edition of the Bay Area Real Estate Update! As we move into this new month, the Bay Area real estate market continues to be dynamic and ever-evolving. In this newsletter, we'll explore the latest trends, developments, and insights shaping the market landscape.


The Local Lowdown

Quick Take:
  • Median home prices are slightly below peak levels across the Bay Area. As more new listings come to market, we expect prices to continue rising and to reach new highs in the summer months.
  • Active listings, sales, and new listings rose month over month, which are all beneficial for the housing market. We expect inventory to increase in the first half of the year, and possibly return to a more normal market, after the slowdown experienced over the past year and a half.
  • Months of Supply Inventory has declined sharply in 2024, indicating that buyer competition is ramping up. MSI implies a sellers’ market in most of the Bay Area.
Note: You can find the charts/graphs for the Local Lowdown at the end of this section.
 

Median single-family home prices rose month over month across the Bay Area

In the Greater Bay Area, low inventory and high demand have more than offset the downward price pressure from higher mortgage rates, and prices generally haven’t experienced larger drops due to higher mortgage rates. Month over month, in April, median single-family home prices were only slightly below their all-time highs. Even Marin and San Francisco prices, which were extremely far below their previous peaks, have risen dramatically in 2024. Condo prices have been less volatile than those of single-family homes, moving more horizontally over the past two years. We expect prices in the Bay Area to remain slightly below peak until the early summer, but prices will almost certainly reach new highs in the second quarter of 2024 in the North and East Bay. Low, but rising inventory is only increasing prices as buyers are better able to find the best match.
 
High mortgage rates soften both supply and demand, but homebuyers seemed to tolerate rates above 6%. Now that rates are above 7%, sales may slow slightly in the next couple of months, which isn’t great for the market, but isn’t it terrible, either, as it may allow inventory to build in a massively undersupplied market.
 

Single-family home inventory, sales, and new listings increased month over month

Since the start of 2023, single-family home inventory has followed fairly typical seasonal trends, but at significantly depressed levels. Low inventory and fewer new listings have slowed the market considerably. Typically, inventory peaks in July or August and declines through December or January, but the lack of new listings prevented meaningful inventory growth. New listings have been exceptionally low, so the little inventory growth in 2023 was driven by softening demand. In December 2023, inventory and sales dropped. However, more new listings have come to the market in 2024, which has driven the significant increase in sales so far this year. The market is already looking healthier, and we expect more new listings and sales in Q2 2024.
 

Months of Supply Inventory fell in April 2024, indicating a sellers’ market

Months of Supply Inventory (MSI) quantifies the supply/demand relationship by measuring how many months it would take for all current homes listed on the market to sell at the current rate of sales. The long-term average MSI is around three months in California, which indicates a balanced market. An MSI lower than three indicates that there are more buyers than sellers on the market (meaning it’s a sellers’ market), while a higher MSI indicates there are more sellers than buyers (meaning it’s a buyers’ market). The Bay Area markets tend to favor sellers, which is reflected in their low MSIs. San Francisco MSI is notable for its variability over the past year, oscillating from buyers’ to sellers’ markets twice over the course of 12 months. Currently, MSI is below three months of supply (a sellers’ market) in every Bay Area county, except for single-family homes in Napa and condos in Marin, Napa, and San Francisco, which are now balanced.
 

Local Lowdown Data


The Big Story

Rates ↑, Sales ↓

Quick Take:
  • Prices have already risen 6.8% over the past three months, landing only 2.2% below the all-time high reached in June 2022. Additionally, the median list price per square foot hit an all-time high in April 2024.
  • Mortgage rates rose nearly a half a percentage point in April due to changing Fed rate cut expectations, hitting the highest level yet in 2024. The Fed has expressed that inflation is taking longer to settle at 2% than originally expected, so higher rates will likely be here for most — if not all — of 2024.
  • Sales fell 4.3% month over month, and inventory rose 4.7%. The combination of rising prices and interest rates priced buyers out of the market, which dropped sales.
Note: You can find the charts & graphs for the Big Story at the end of the following section.
 

Another market slowdown

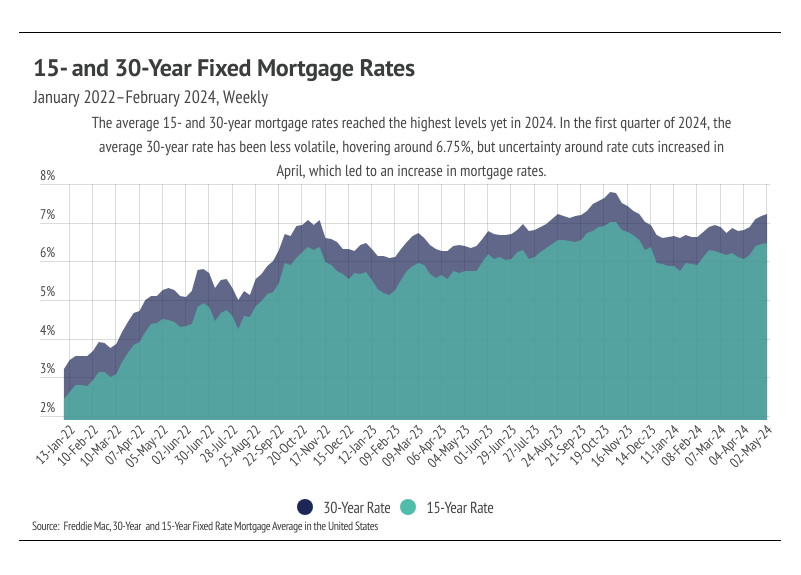
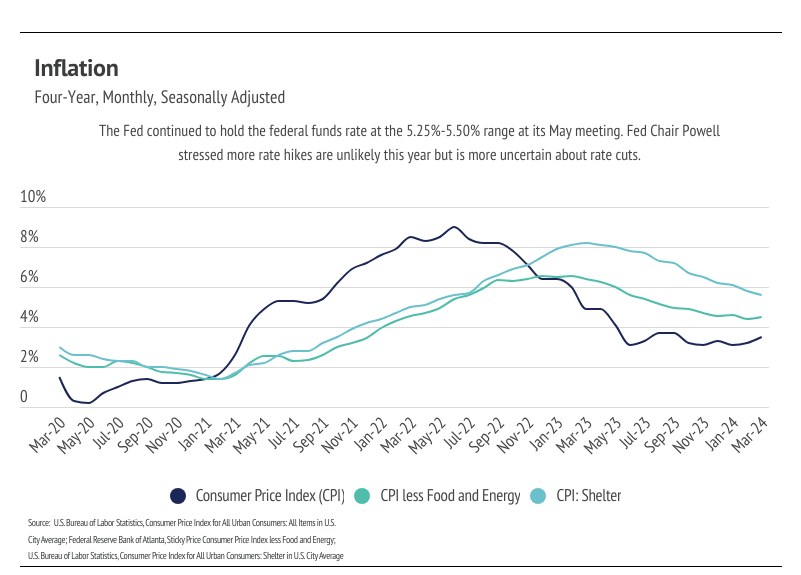
The average 30-year mortgage rate began the year at 6.62%, marking the start of the third year mortgage rates have been elevated. However, the rate expectations for 2024 in January were far different from those today. In January, inflation was still trending lower and economists were predicting rate cuts as early as March. Unfortunately, the inflation rate stopped falling around 3%, never quite reaching the 2% target, which has caused the Fed to delay cutting the federal funds rate, which indirectly, but significantly, influences credit markets. The past two months, in fact, inflation has increased year over year, which isn’t ever going to move the timetable for rate cuts earlier.
 
During its May meeting, the Federal Reserve unanimously voted to hold policy rates steady for the sixth consecutive time, leaving the federal funds target rate unchanged at 5.25% to 5.50%. Importantly, Fed Chair Jerome Powell emphasized that it’s unlikely that the next policy rate move will be a hike; it’s more likely that rates remain steady and with less clarity of cuts. The Fed’s dual mandate aims for stable prices (inflation ~2%) and low unemployment. The jobs market is still strong, so really, it’s all about inflation.
 
The Fed’s change of tune has led to much higher mortgage rates. Mortgage rates have risen 0.6% since the start of the year, and two thirds of that increase happened in April. Rising rates, especially quickly rising rates, only slow the housing market. As we entered May, the average 30-year mortgage rate hit 7.22% — the highest level in 2024 and not too far off from the 23-year high of 7.79% hit last year. During April, prices and rates increased, thereby decreasing affordability. For buyers planning to finance a home, the 0.38 percentage point increase that occurred in April affects the monthly cost of a home dramatically. When we couple the median price increase with the mortgage rate increase in just the month of April, the monthly cost increased 7%. If we compare the month cost in January to April, the monthly cost rose 13%.
 
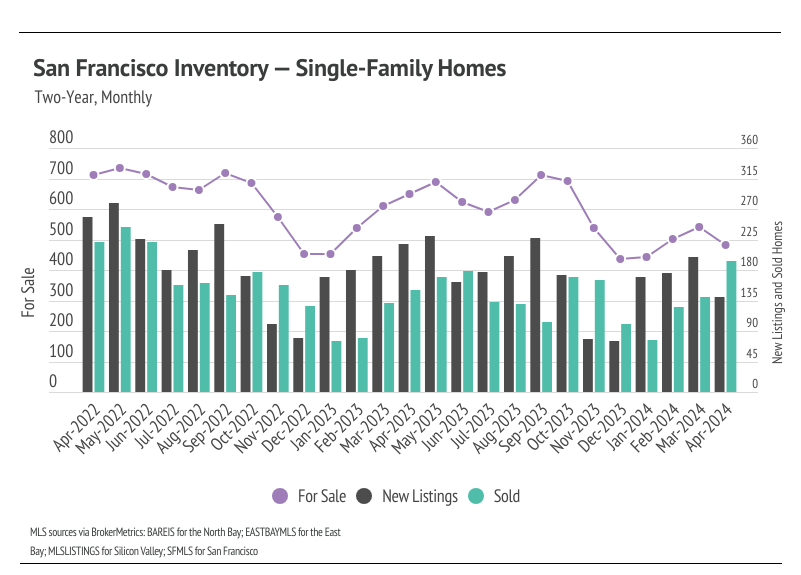
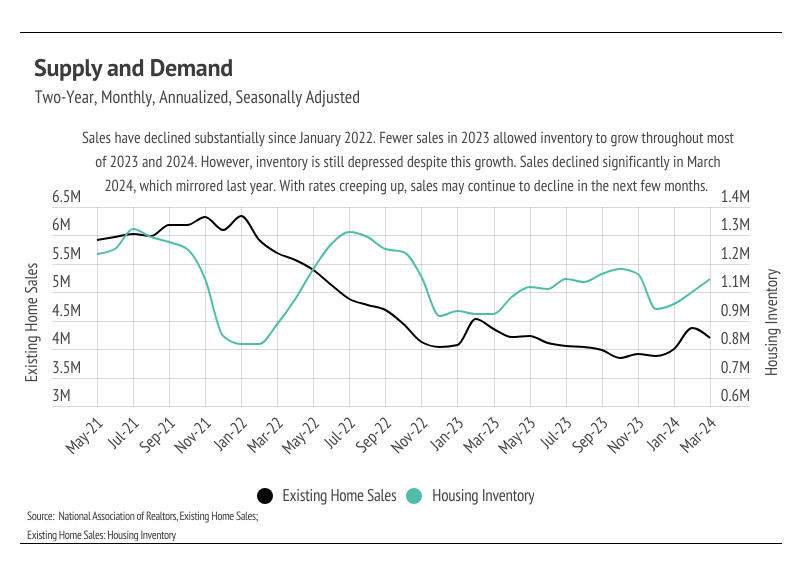
Rates seem to be able to inflate prices and increase sales when they’re low, but when they’re high, they only slow sales — or, at least, that’s been the experience over the past four years. Inventory is, of course, driving the disconnect. Demand is still high relative to supply, even though inventory is growing. However, as prices increase, the buyers who haven’t been priced out of the market become pickier, and fewer but pickier buyers creates an overall slowdown. The market was showing signs of a more normal spring with sales and inventory rising, but the recent rate increases dropped sales last month, which is almost never seen in the spring. Even though mortgage rates have been elevated for long enough that it feels more normal, mortgage rates above 7% will naturally give potential buyers and sellers pause before entering the housing market.
 
Different regions and individual houses vary from the broad national trends, so we’ve included a Local Lowdown below to provide you with in-depth coverage for your area. As always, we will continue to monitor the housing and economic markets to best guide you in buying or selling your home.
 

Big Story Data


Let’s Talk

You’ve got questions and we can’t wait to answer them.